Master your break-even analysis

Visualize your path to profitability with interactive break-even analysis. Understand your cost structure, forecast revenue needs, and make data-driven decisions with confidence.

Revenue €0
Variable Costs €0
Total Costs €0
Operating Profit €0
Revenue
€100,000
Current period revenue
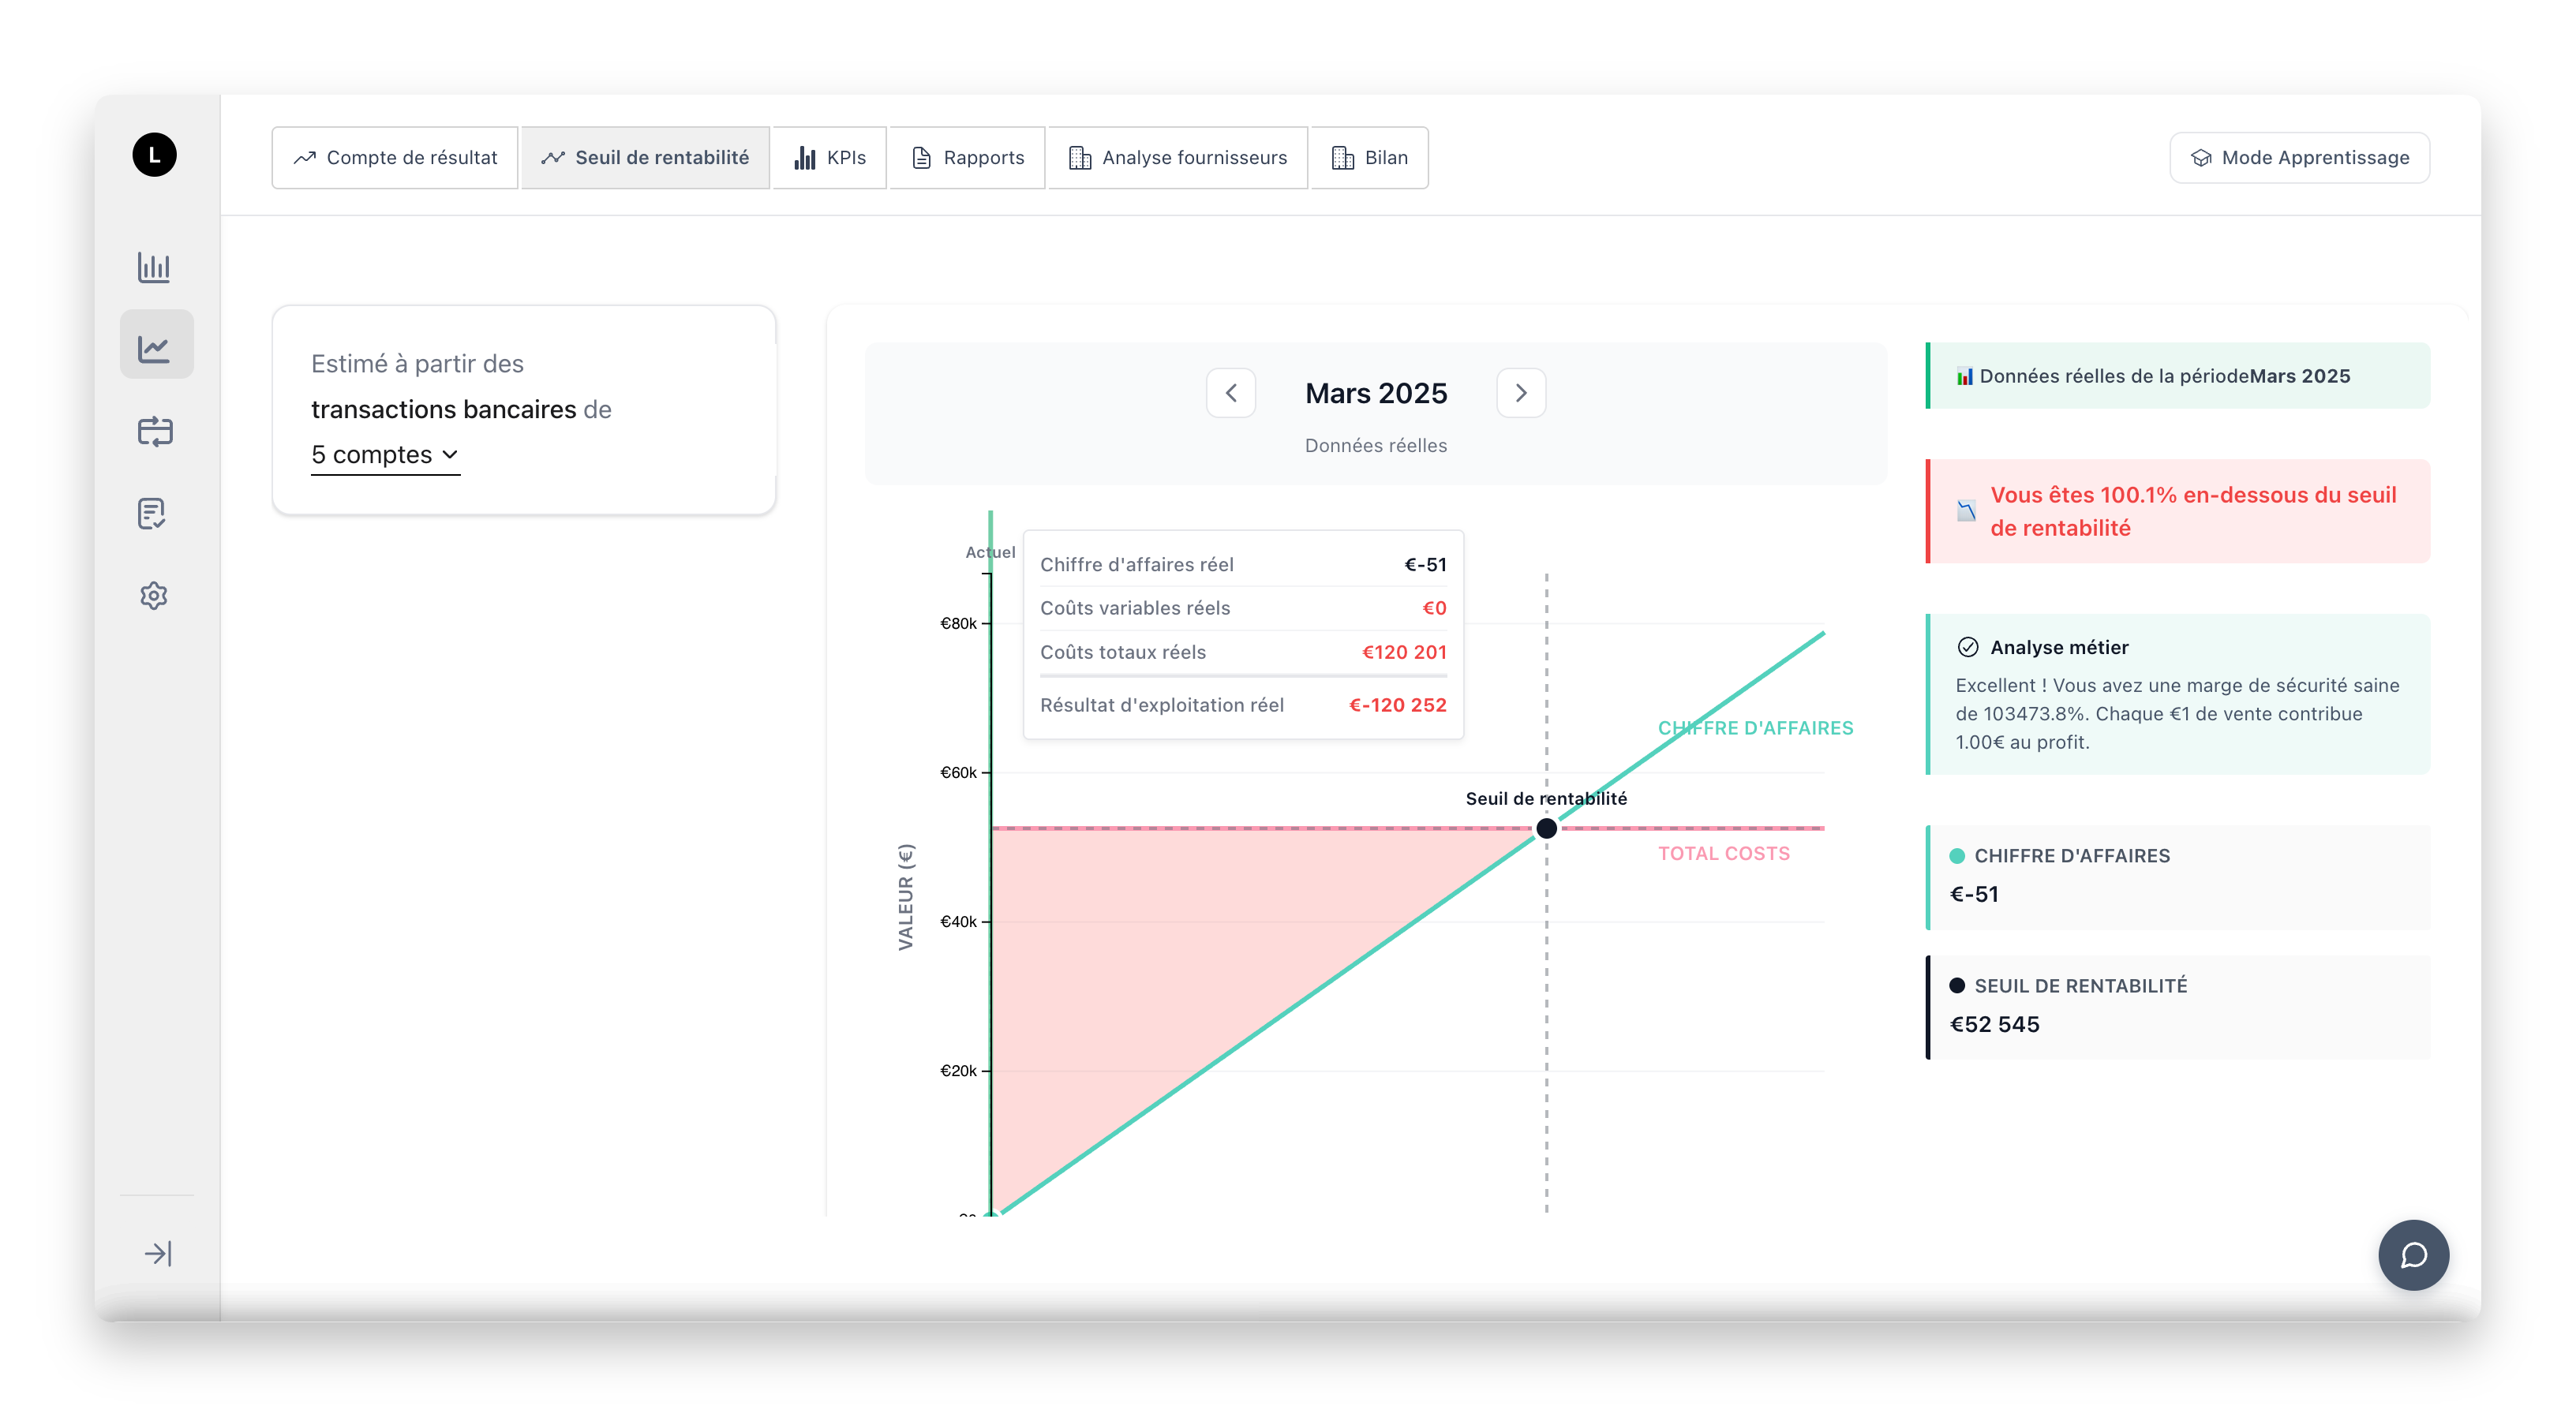
Break-Even Point
€71,429
Minimum revenue to cover costs
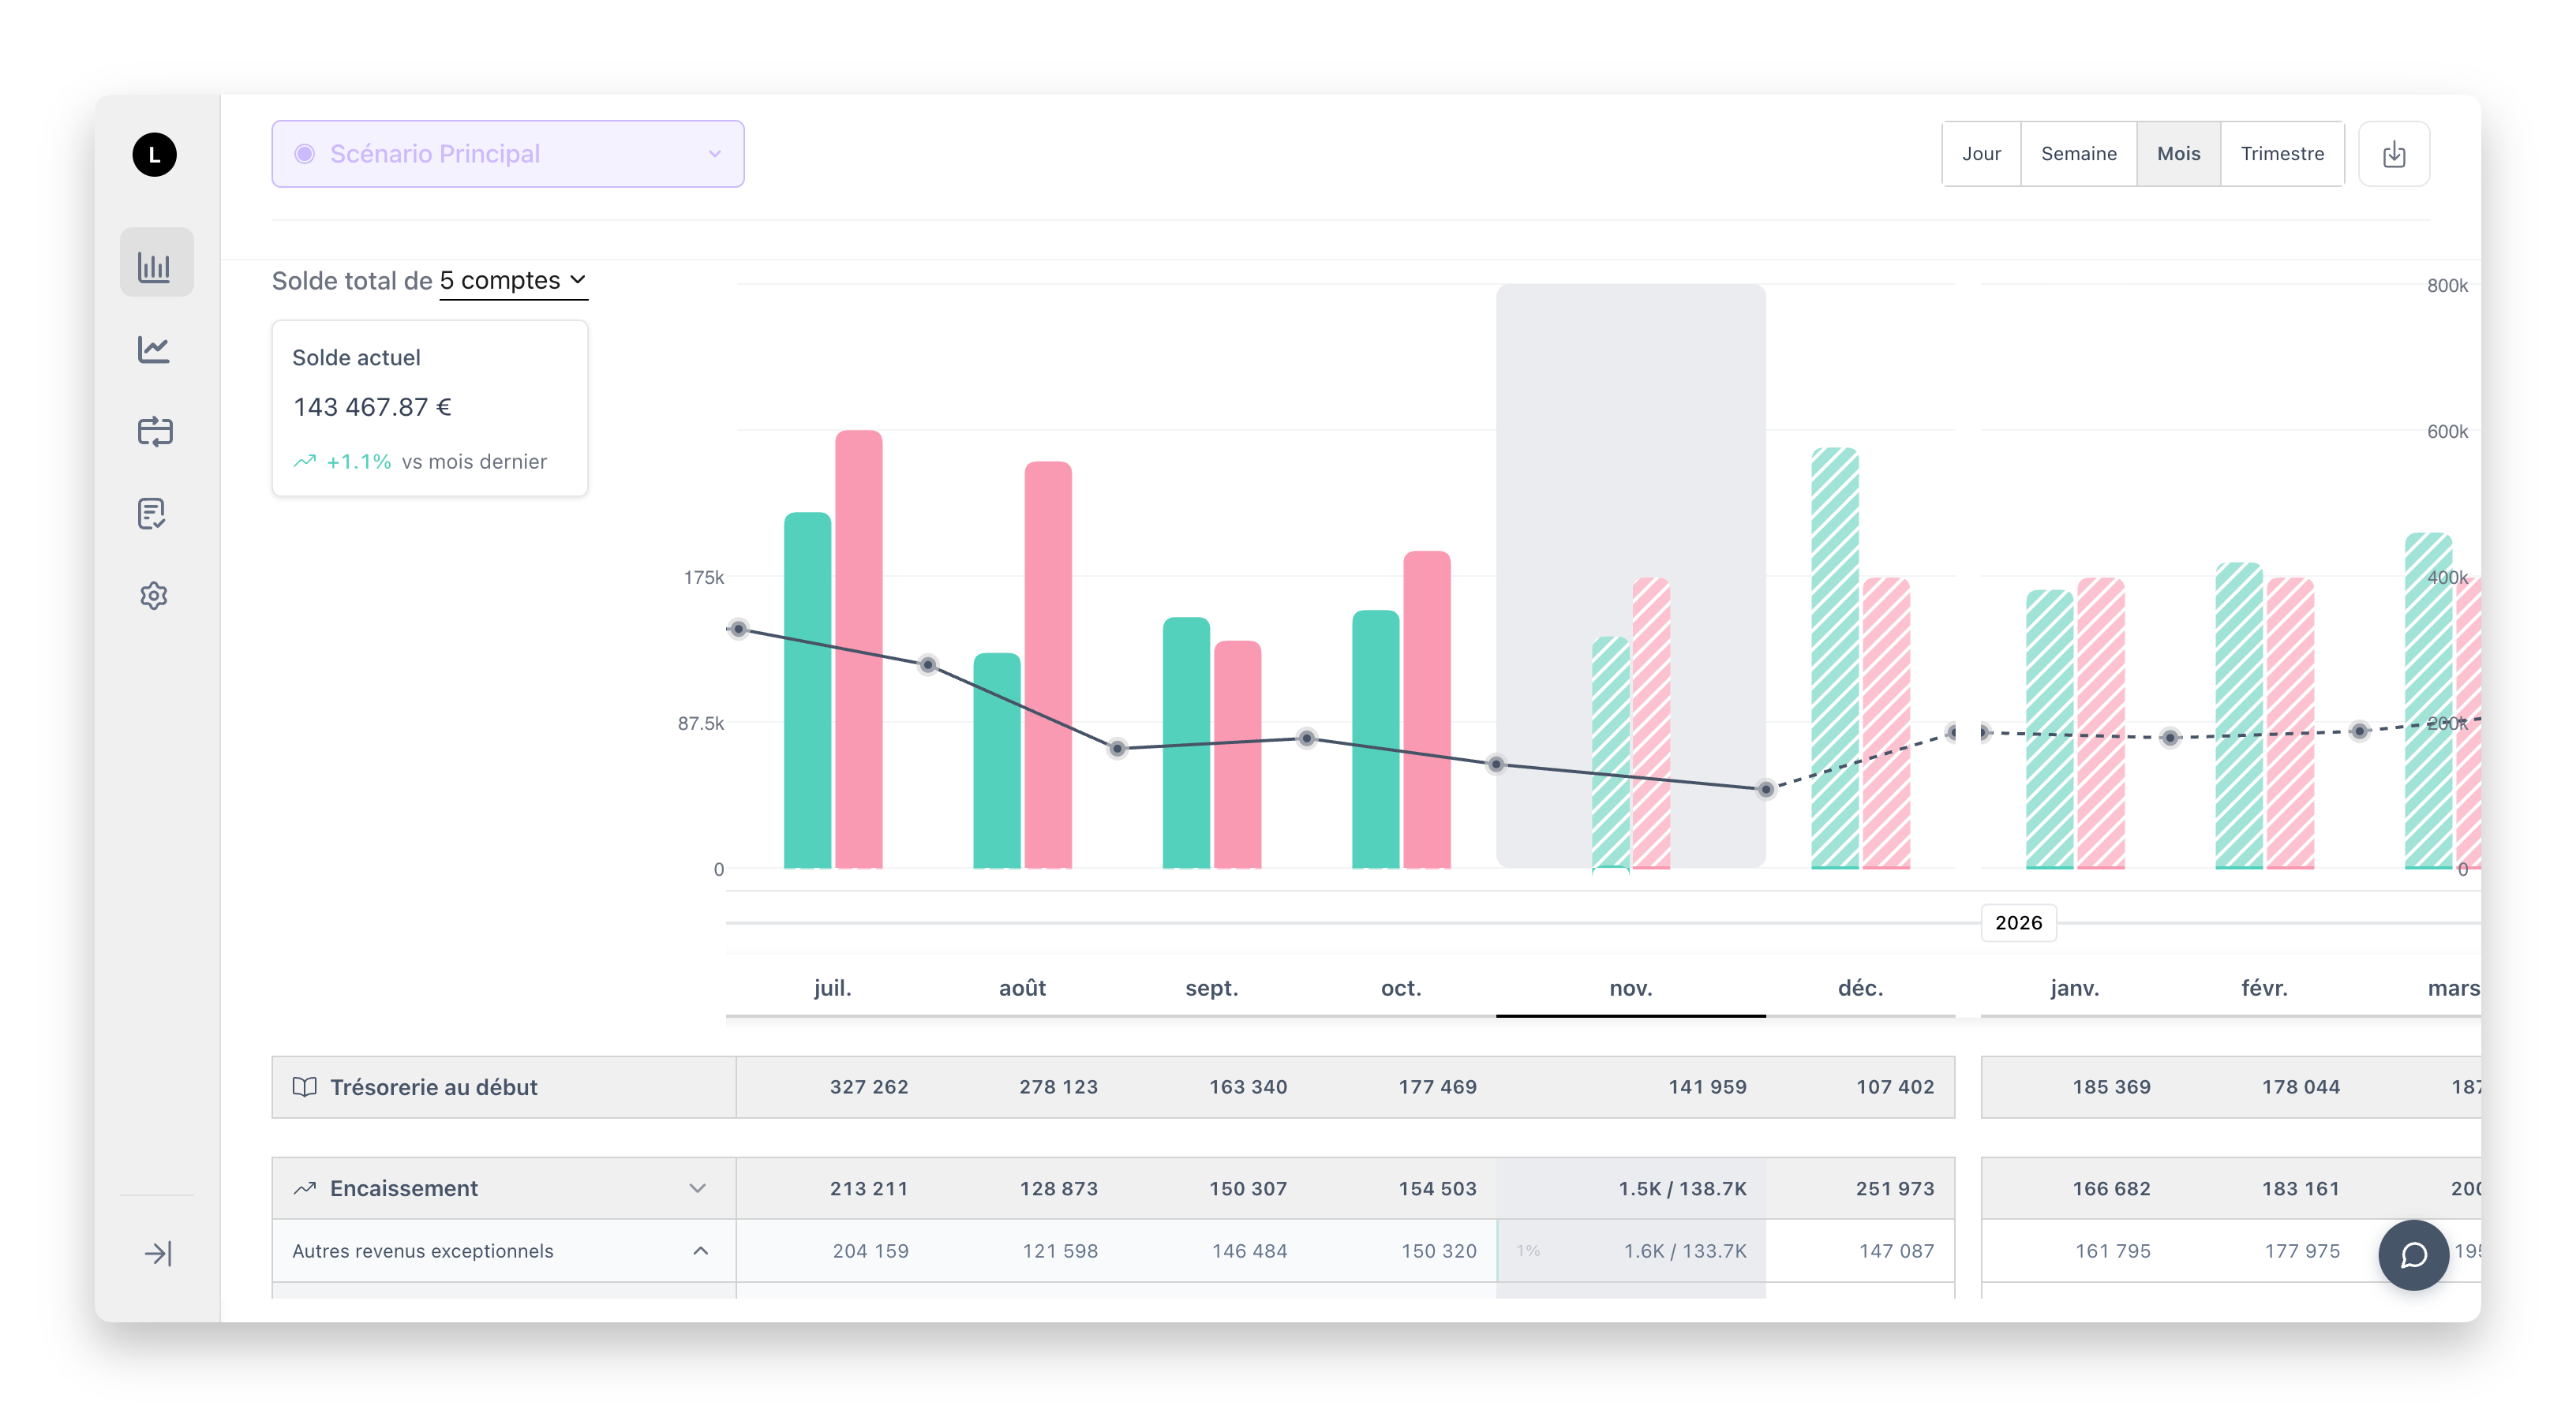
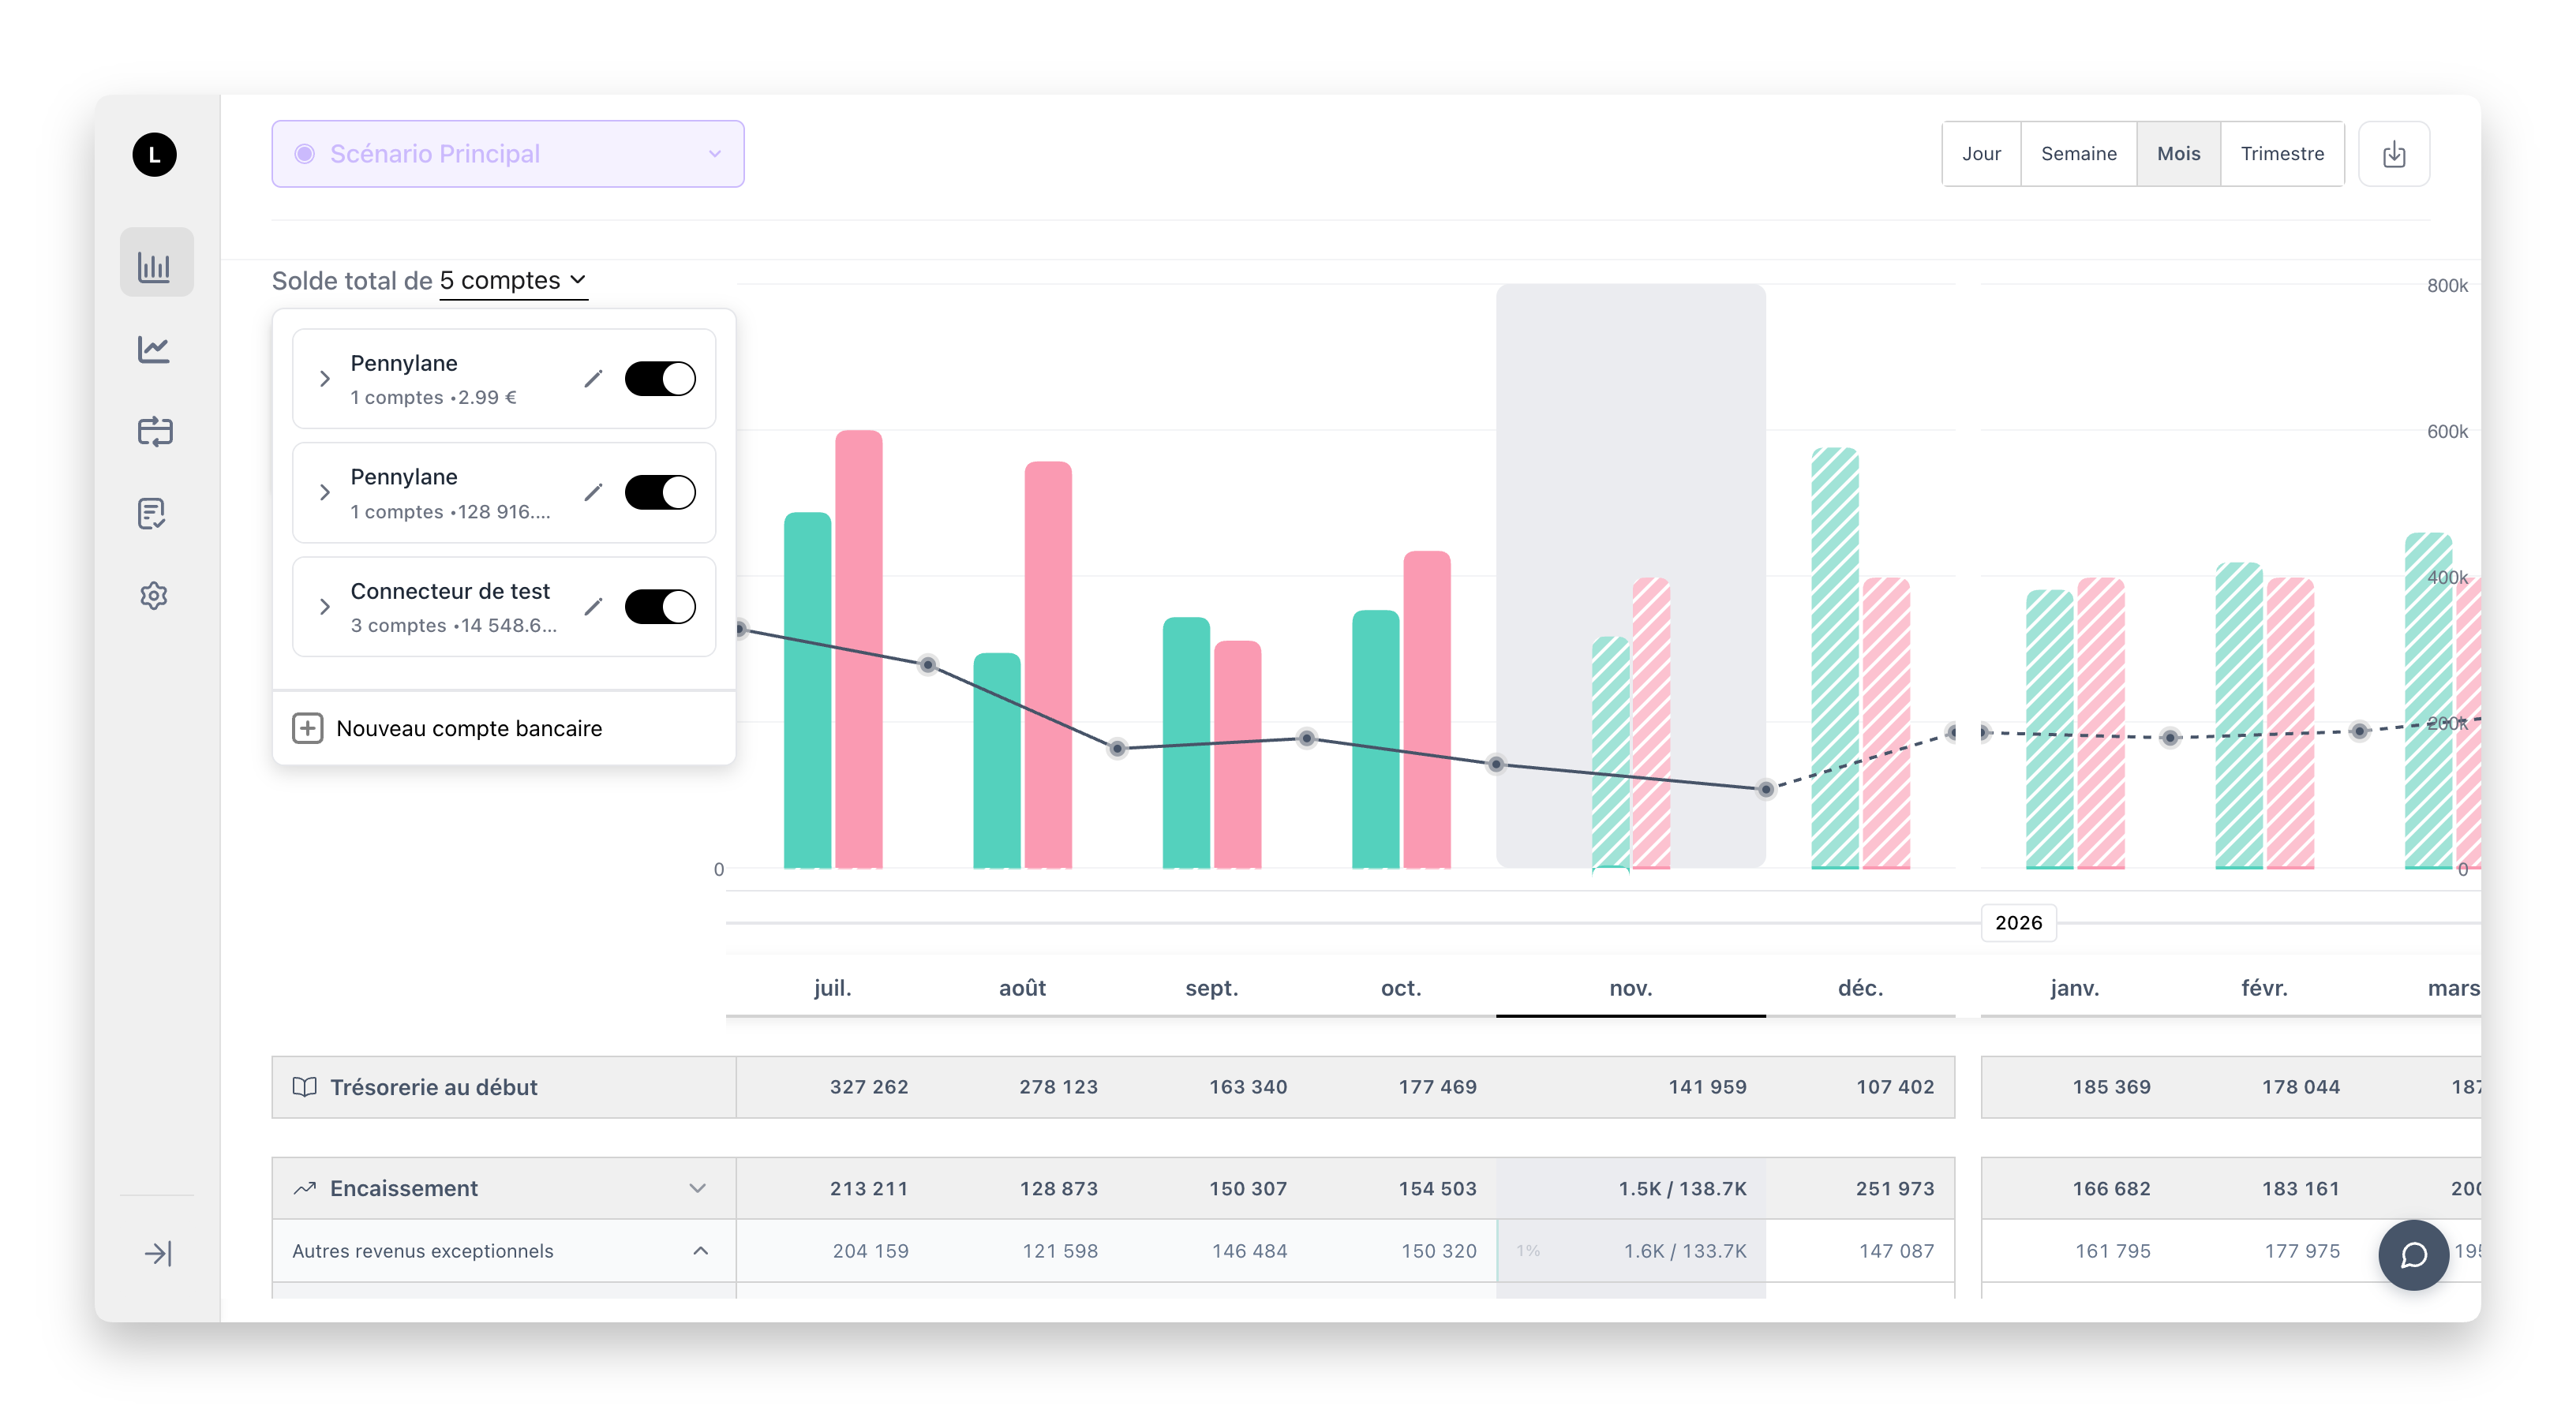
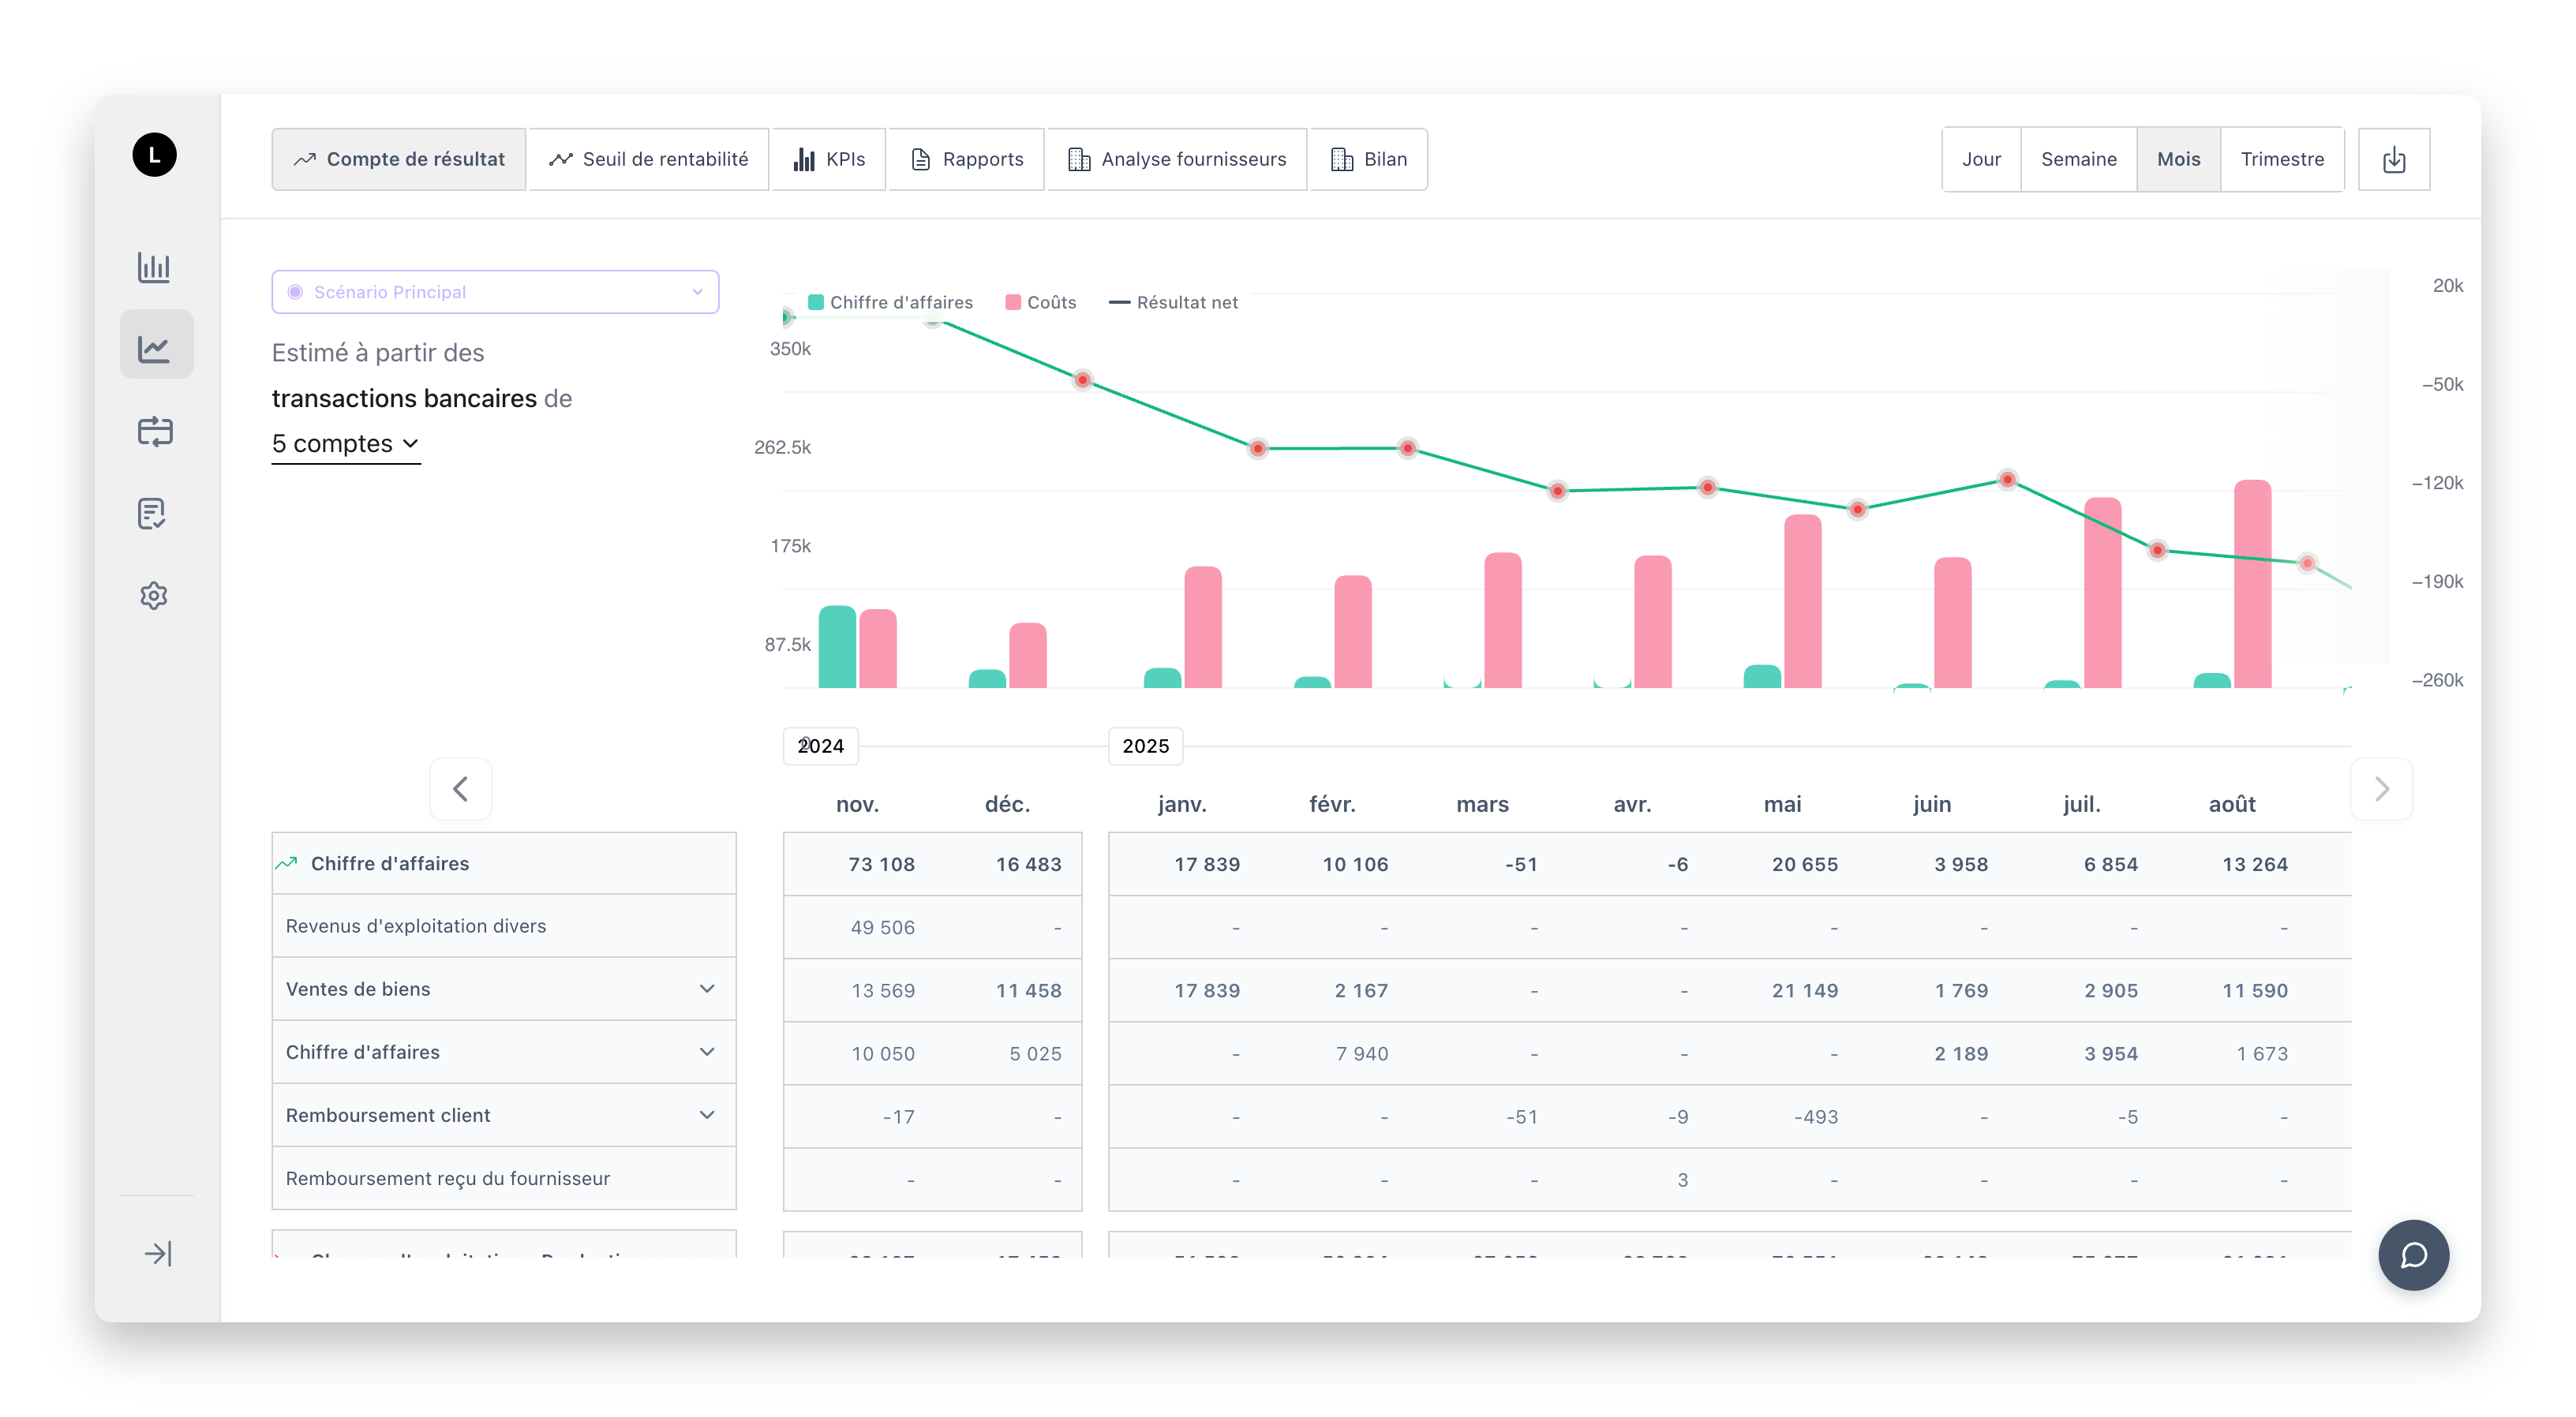
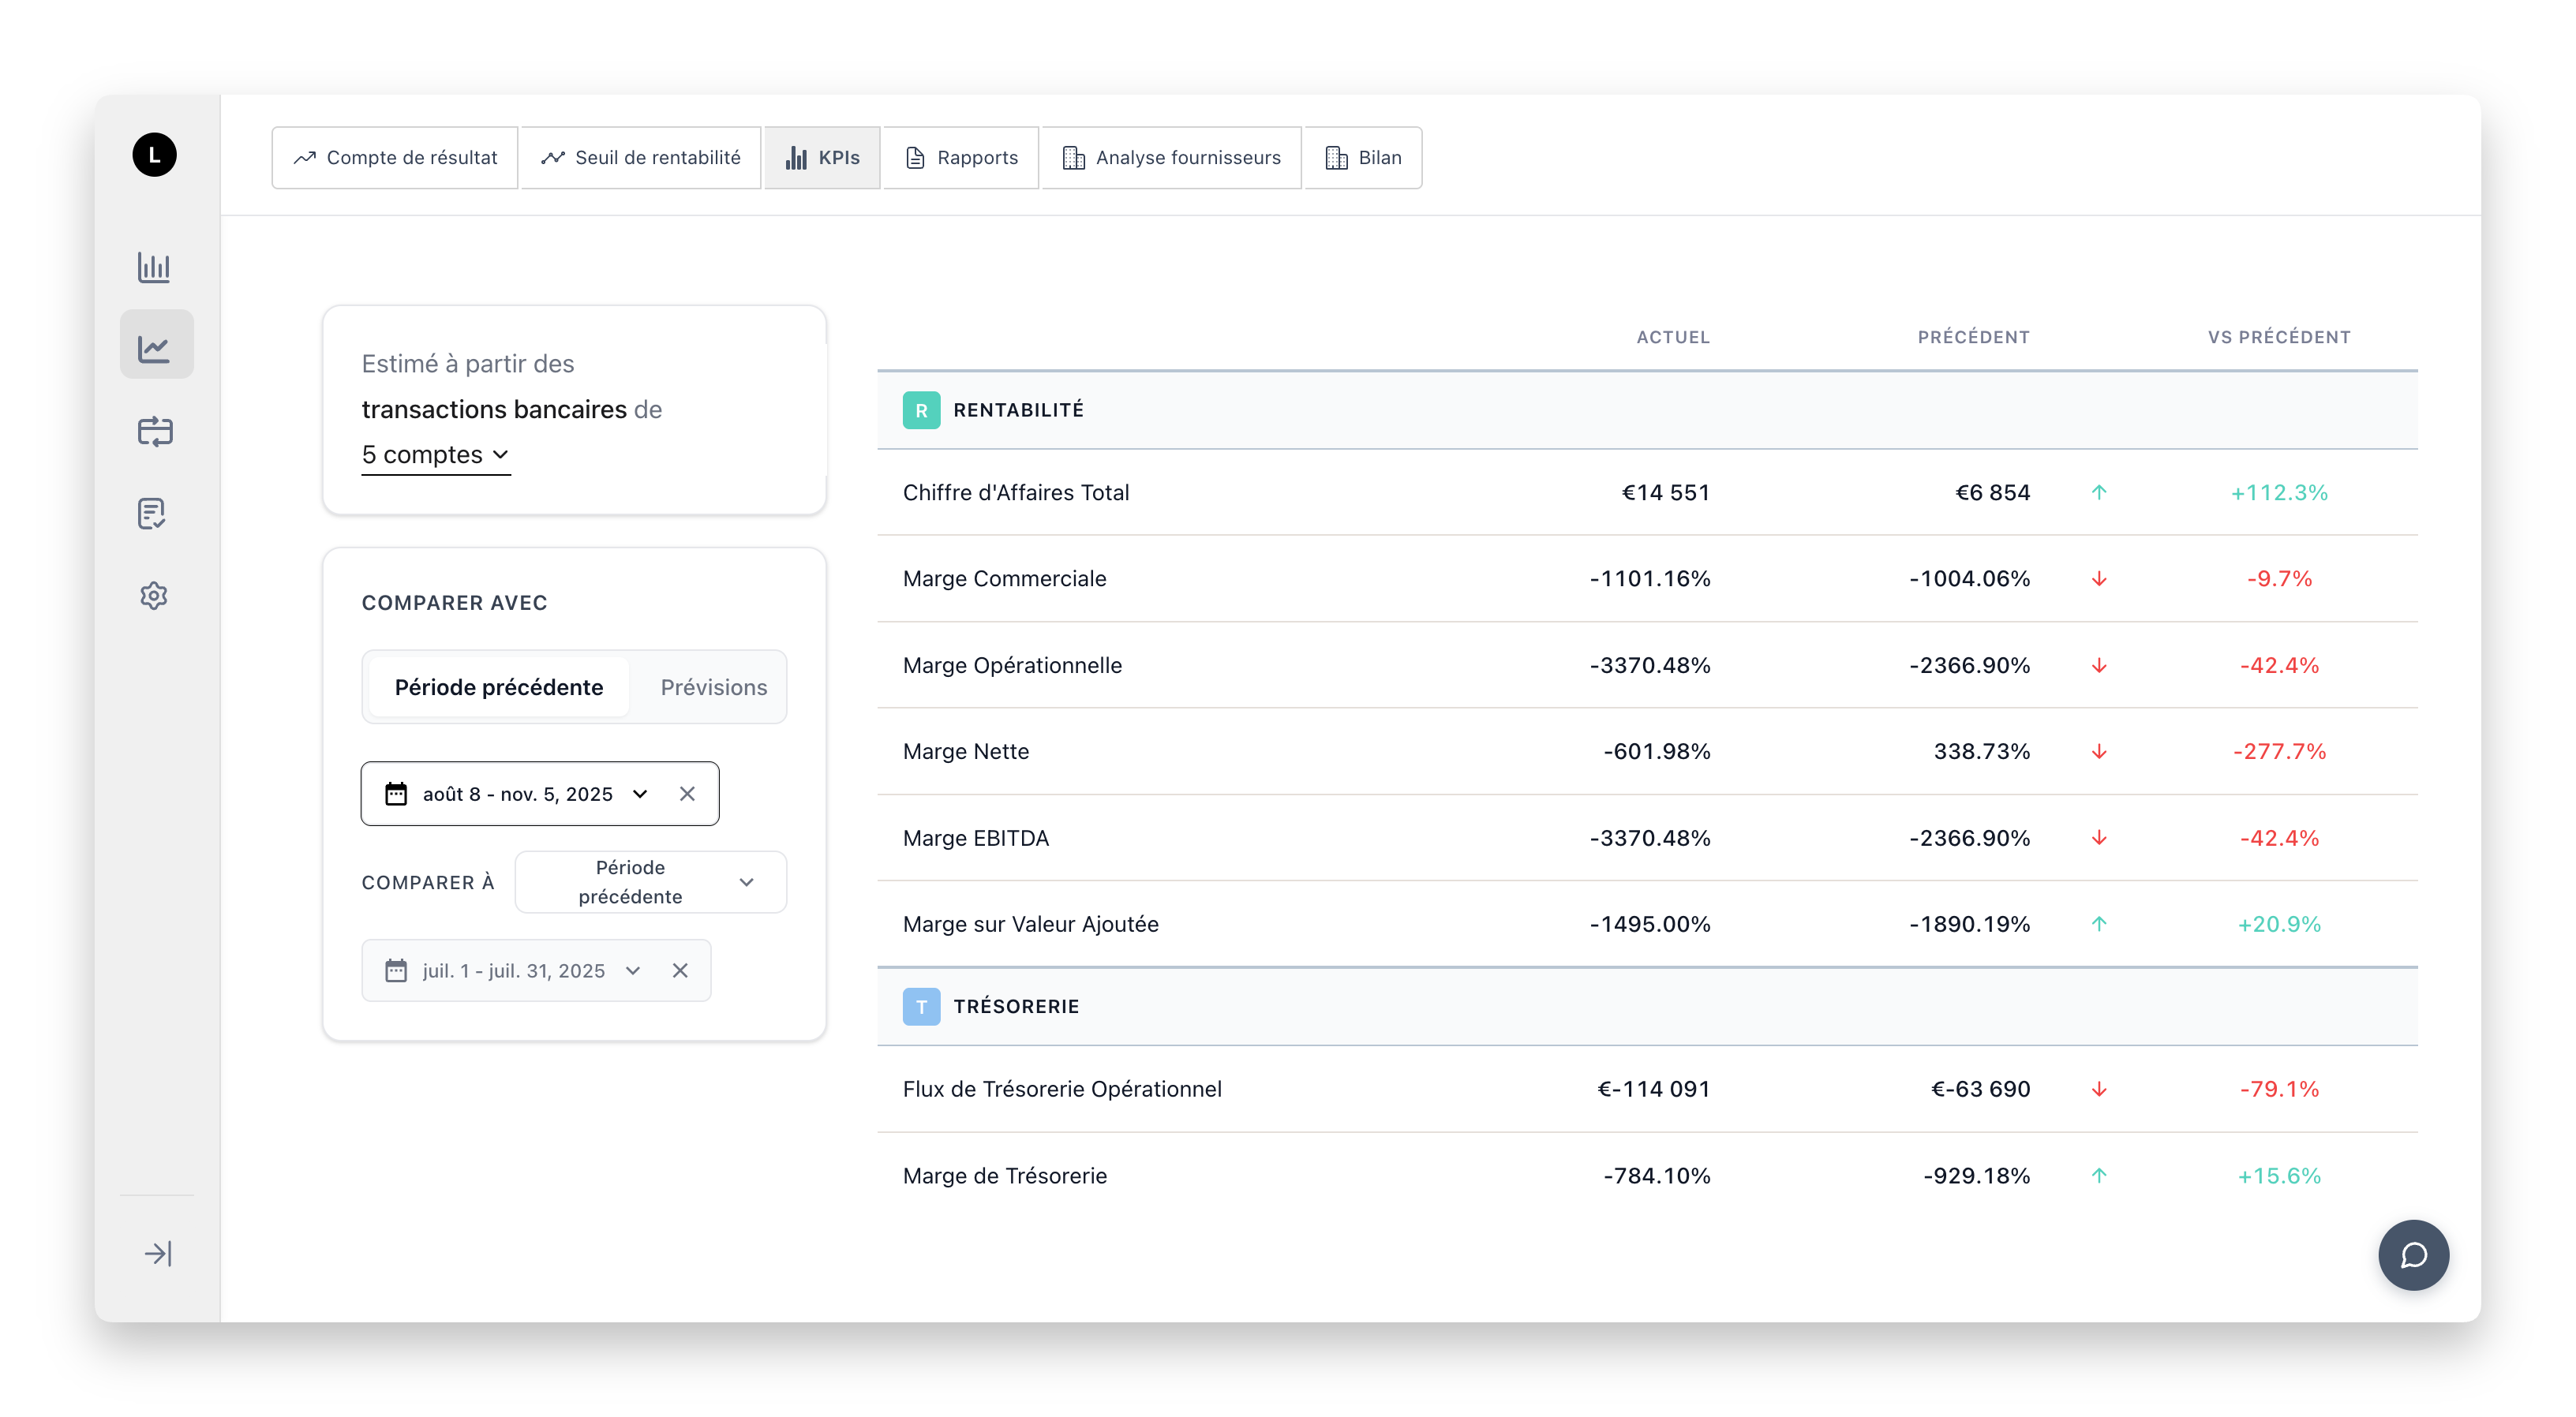
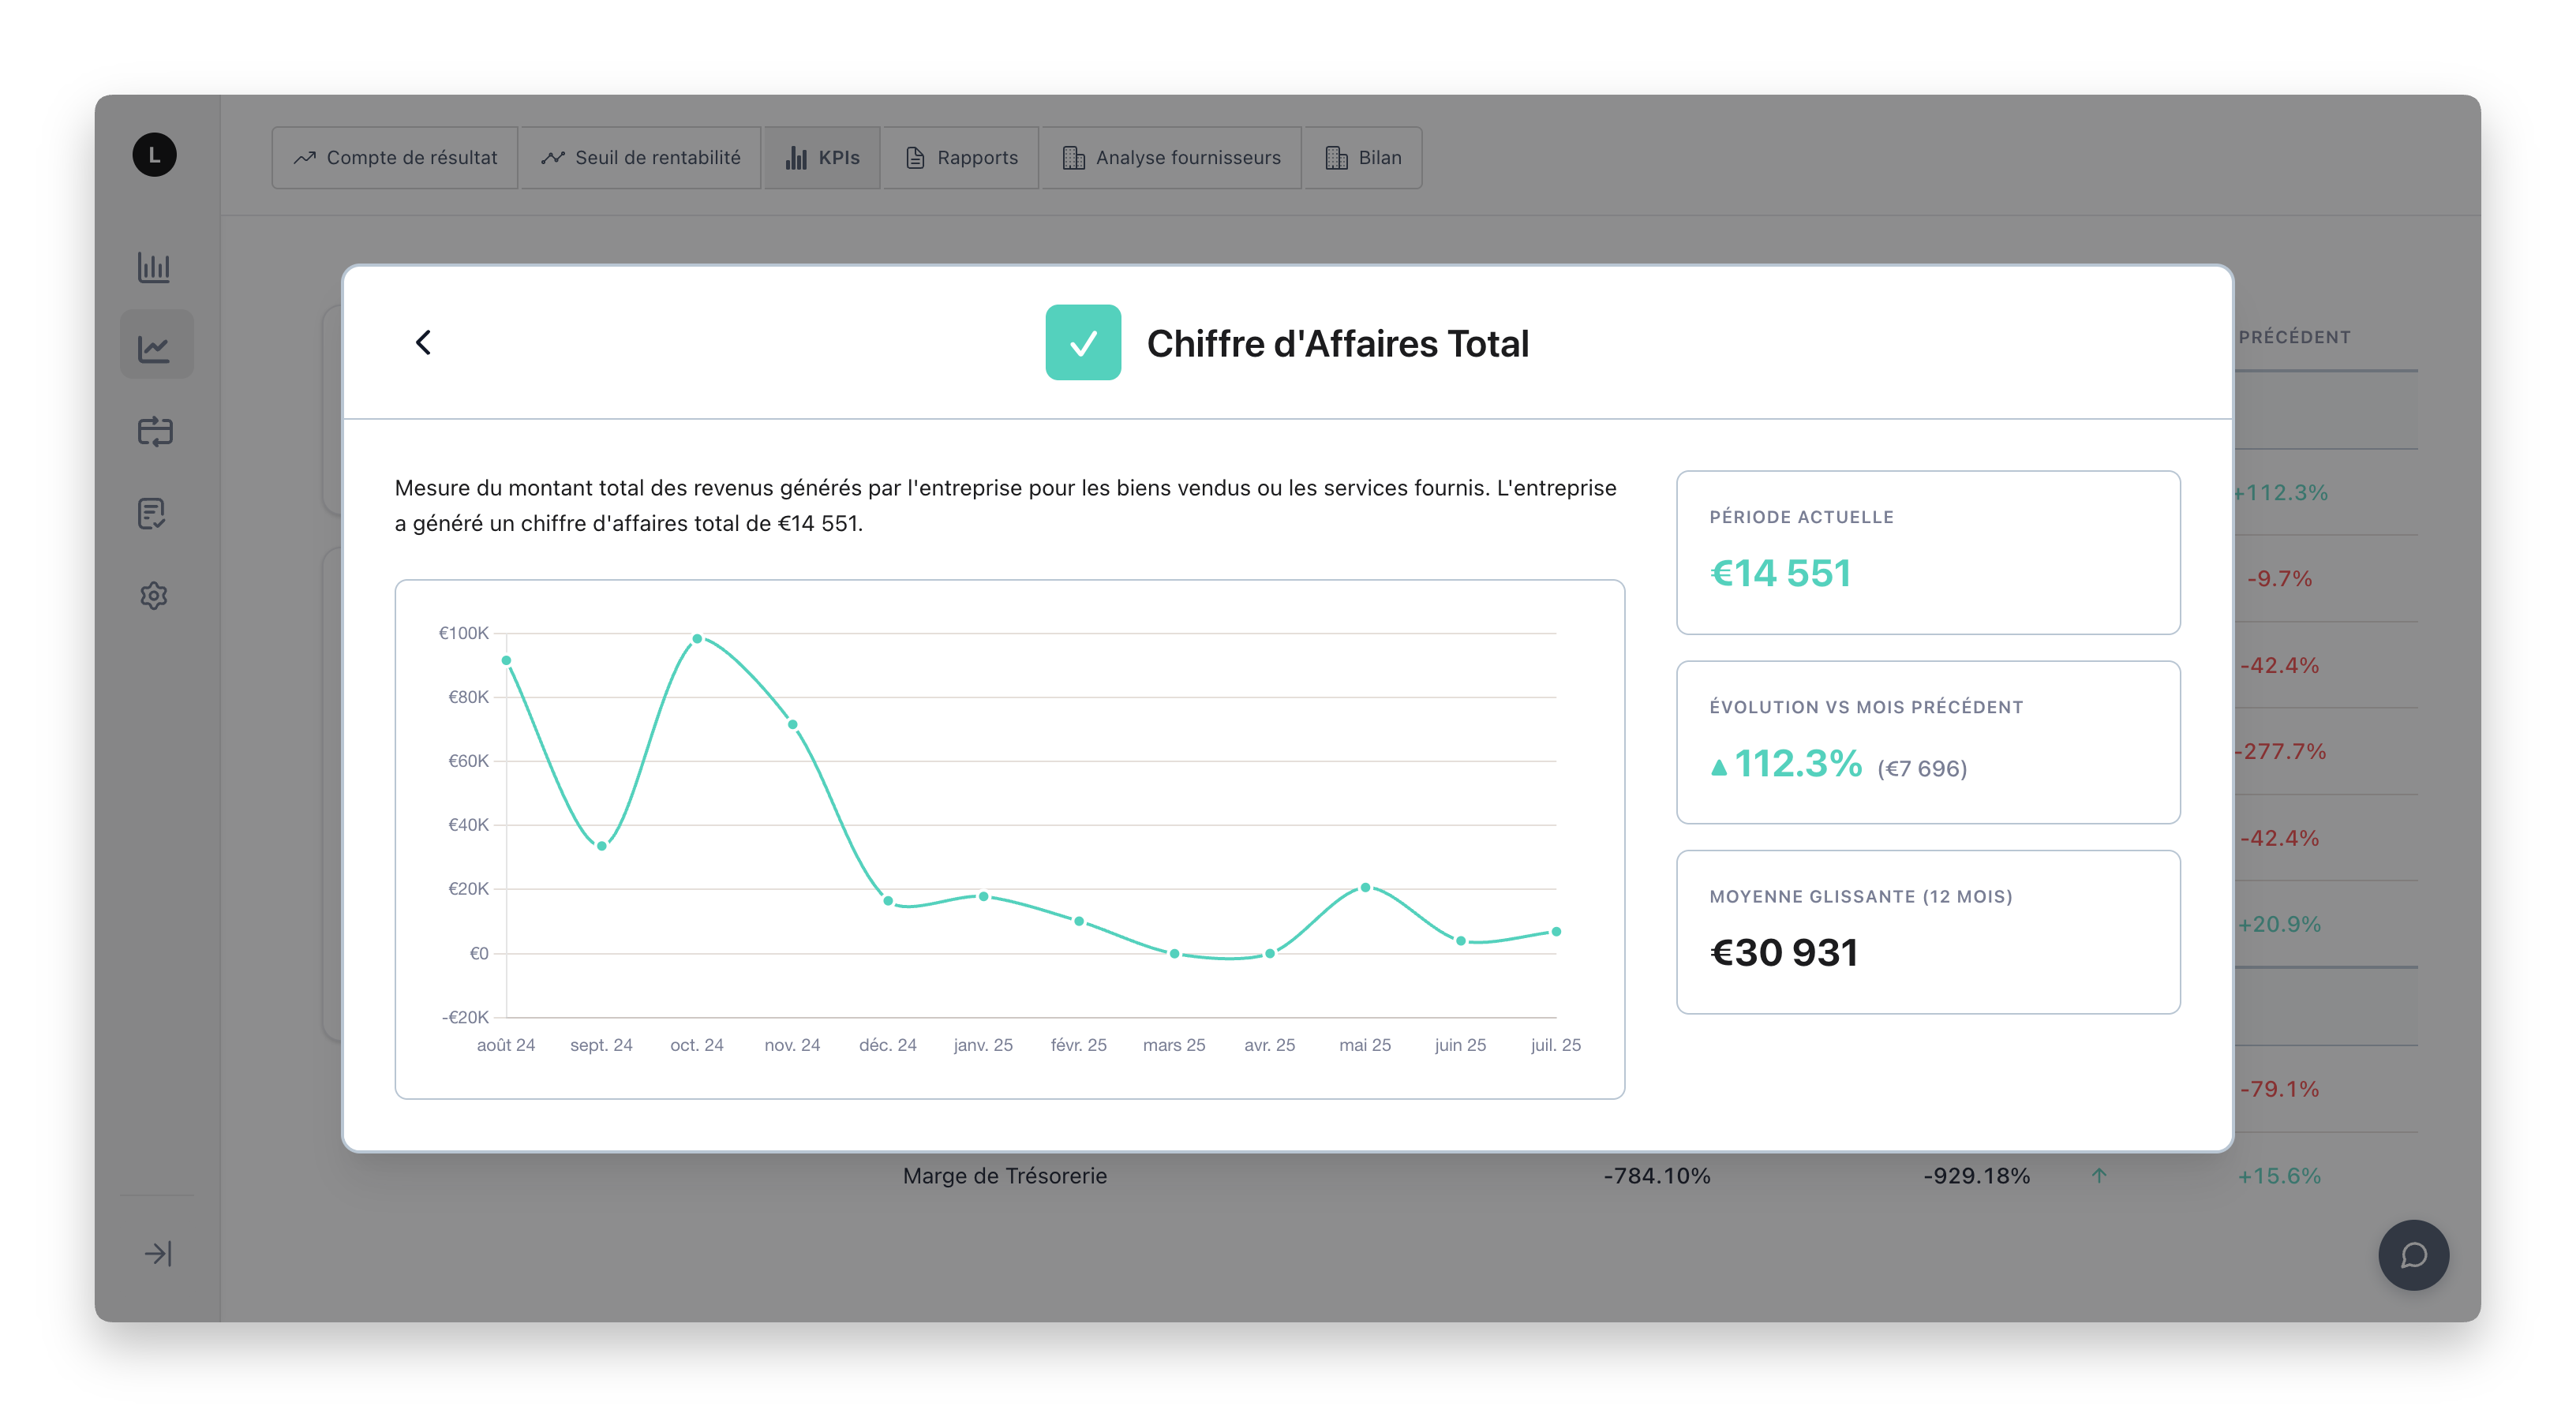
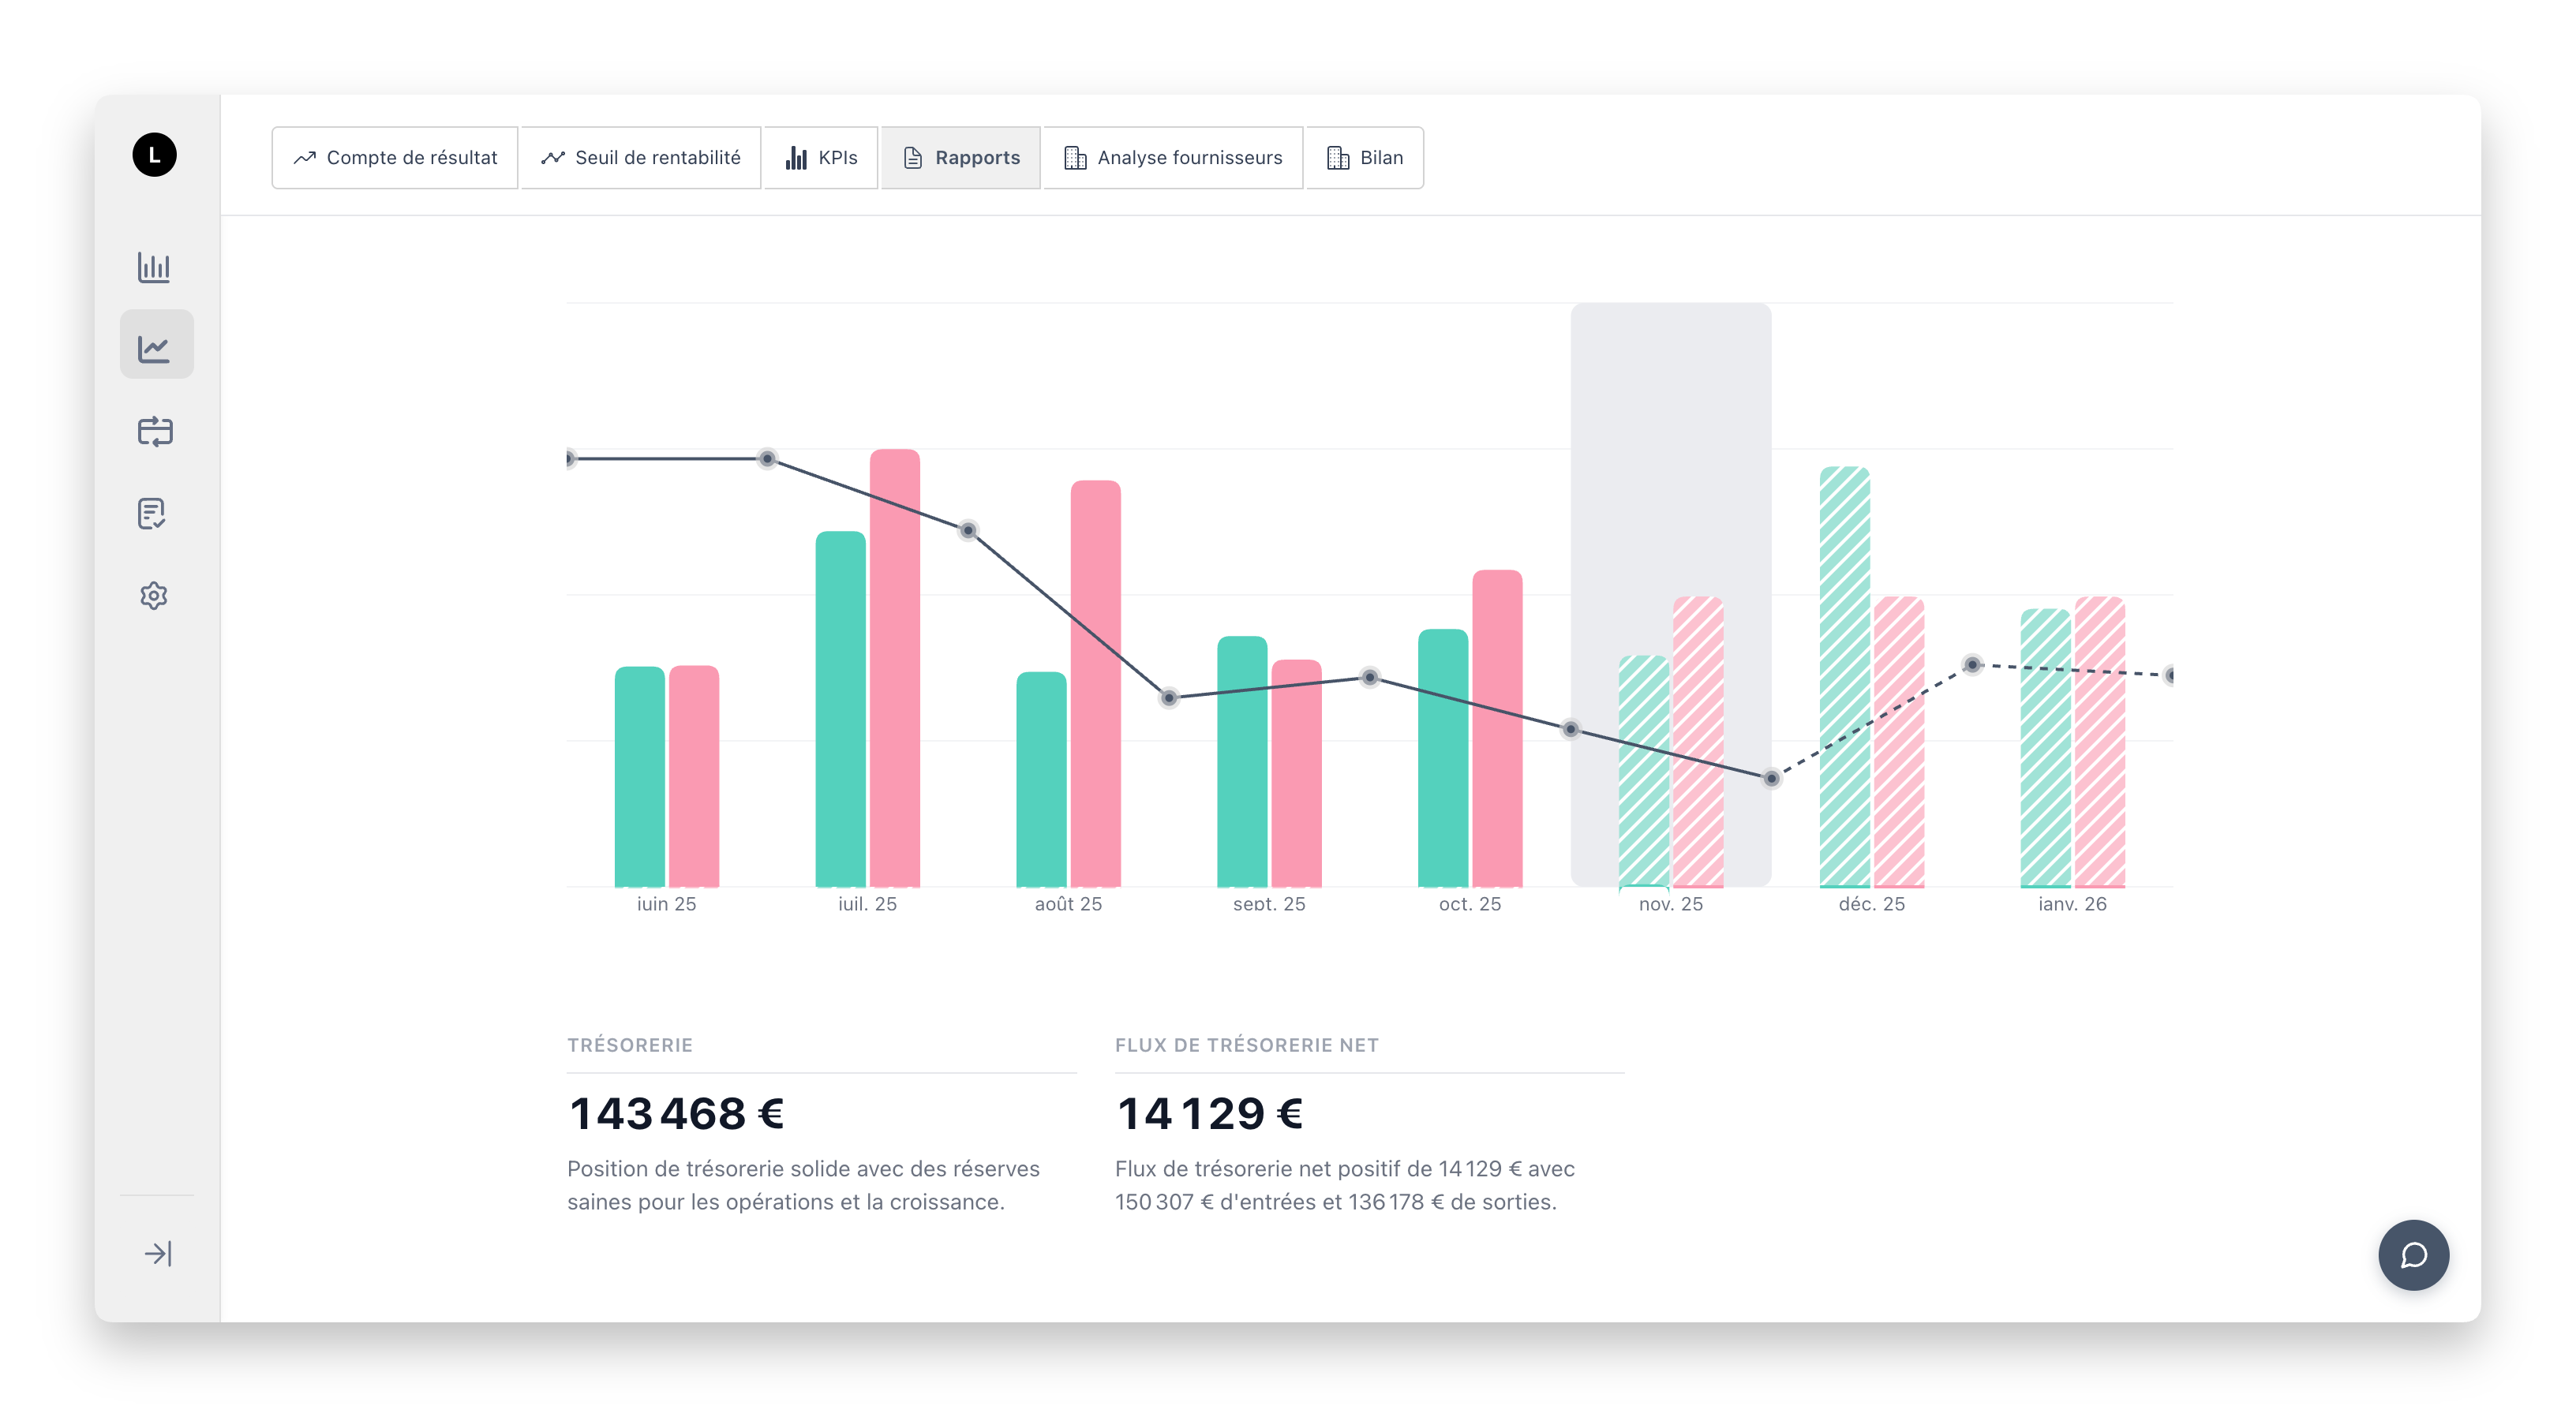
Trezy break-even analysis dashboard Cost structure visualization Profitability forecast charts Revenue targets planning interface Fixed and variable costs analysis Break-even point calculation dashboard Financial planning scenarios view Trezy break-even analysis dashboard Cost structure visualization Profitability forecast charts Revenue targets planning interface Fixed and variable costs analysis Break-even point calculation dashboard Financial planning scenarios view
99.9%
Calculation Accuracy
Real-Time
Instant Updates
Unlimited
Scenario Planning
AI-Powered
Business Insights

Stop Guessing, Start Planning

Most businesses struggle to understand their true break-even point and path to profitability

📊

Complex Cost Structures

Fixed costs, variable costs, semi-variable costs—understanding how they interact is challenging without proper tools.

🎯

Unclear Revenue Targets

Without knowing your break-even point, setting realistic sales targets becomes guesswork rather than strategy.

💡

Delayed Decision Making

Spreadsheet-based analysis is time-consuming and error-prone, slowing down critical business decisions.

Everything You Need for Break-Even Analysis

📈

Interactive Visualization

See your break-even point and profit zones instantly with dynamic charts that update as you adjust your assumptions.

🎯

Scenario Planning

Test different cost structures and revenue scenarios to understand how changes impact your profitability threshold.

💰

Cost Structure Analysis

Understand the relationship between fixed costs, variable costs, and your contribution margin for smarter pricing decisions.

🤖

AI-Powered Insights

Get actionable recommendations on how to improve your break-even position based on your specific cost structure.

Loved by Finance Teams

★★★★★

"The break-even visualization helped us identify that we needed just 15% more revenue to become profitable. We hit that target in 8 weeks."

Sarah Martinez
Founder, TechStart
★★★★★

"Understanding our contribution margin changed how we price our services. We're now 40% more profitable per client."

David Kim
CFO, ConsultPro
★★★★★

"Finally, a tool that makes financial planning accessible. We use it every Monday to track our progress toward profitability."

Emma Wilson
COO, Growth Labs

Perfect for Every Business

SaaS & Tech

Model subscription growth and understand when recurring revenue covers your burn rate.

E-Commerce

Balance product costs, shipping, and marketing spend against revenue targets.

Consulting & Services

Optimize pricing and utilization rates to maximize profitability per consultant.

Retail & Manufacturing

Understand unit economics and the volume needed to cover fixed overhead costs.

Common Questions About Break-Even Analysis

How do I calculate my break-even point?

Your break-even point is calculated by dividing your fixed costs by your contribution margin (1 - variable cost ratio). For example, with €50,000 in fixed costs and a 30% variable cost ratio, your break-even point is €71,429 in revenue. Trezy calculates this automatically and shows you exactly where you stand.

What's the difference between fixed and variable costs?

Fixed costs (like rent, salaries, insurance) stay constant regardless of sales volume. Variable costs (like materials, shipping, commissions) increase with each sale. Understanding this distinction is crucial because it determines your contribution margin—how much each sale contributes to covering fixed costs and generating profit.

How often should I review my break-even analysis?

Review your break-even analysis at least monthly, or whenever you make significant changes to costs or pricing. With Trezy's real-time calculator, you can check your position anytime and model different scenarios instantly. Many successful businesses check weekly to ensure they're on track toward profitability goals.

Can I use this for multiple products or services?

Absolutely! While our calculator shows overall business break-even, you can model individual products by isolating their specific variable costs and allocating relevant fixed costs. For complex product mixes, Trezy's full platform offers advanced analysis tools to understand break-even at the product, department, or business unit level.